POLDER 2 - CLOUD PROPERTIES : The cloudy pixel identification

RADIATION BUDGET, WATER VAPOR & CLOUDS
RESULTS
The cloudy pixel identification method
The first stage of the "ERB & clouds" line is the recognition of cloud-contaminated pixels. The "ERB & clouds" cloud detection method is a threshold method employing several sequential tests for the presence of clouds. The physical principles of the method are extensively developed in Buriez et al, (IJRS, 1997) and Parol et al, (IEEE, 1999).
The cloud detection algorithm is mainly based on a series of sequential threshold tests applied to each individual pixel (6.2 km) and for every viewing direction.
The POLDER cloud cover for june 25, 2003 is presented in the following figure. All the large cloud structures associated with the main climate processes are easily identified and their location is coherent with what would expect for the month of June: the Intertropical Convergence Zone (ITCZ) along the 10°N parallel, large clear-sky area over the desert of Sahara, Sout-West Africa, and Australia, subtropical zones of heavy cloud cover west of Perou, Angola, California, and over the northern Pacific ocean.
 |
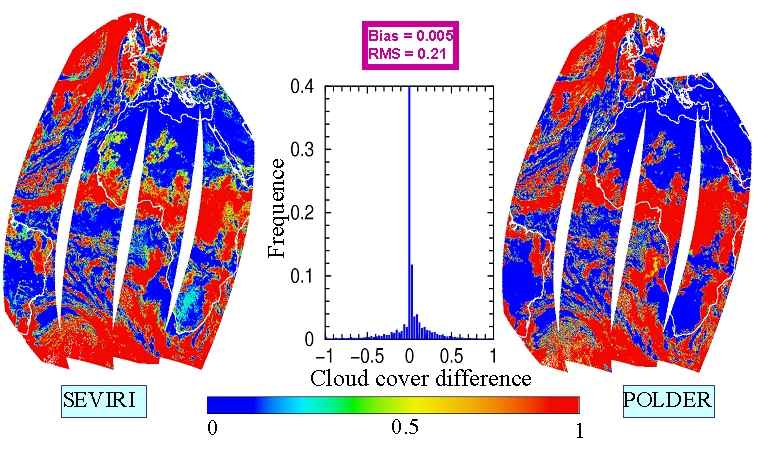
A first validation of the POLDER pixel identification algorithm goes through a comparison with the results of the Dynamical Clustering Method (Sèze and Desbois, 1987) applied to MSG/SEVIRI data acquired every 15 mn between 7 and 14 UTC each day. The spatial resolution of the SEVIRI data at nadir is 3 km. The Dynamical Clustering Method makes use of two spectral parameters, the infrared and visible radiances and two structural parameters, the local spatial standard deviation of the visible and infrared radiances (computed for 3*3 neighbouring pixels). From this set, any ADEOS2/POLDER path in the MSG/SEVIRI field of view can be simulated with a time lag of ± 8 minutes.
The figure presents the pixel identification maps for SEVIRI and POLDER as well as the histogram of the cloud amount differences on June, 25 2003. This figure highlights a very good correlation between the two different methodologies. The co-occurence matrix (not shown here) indicates that about 72% of the pixels belong to the same class (clear/partly/overcast) and that only 0.3% of the pixels belong to opposite classes (clear/overcast or overcast/clear). Some discrepencies appear for broken cloudiness and very thin cirrus cloud cases (mainly over land).
(SEVIRI/MSG data are courtesy provided by the Centre de Meteorologie Spatiale of Lannion)
 |
© CNES Copyrights 2004
